NVIDIA Visual Profiler总结

NVIDIA Visual Profiler

NVIDIA Visual Profiler提供了丰富的图形用户环境,可以给出CUDA在后台工作的更多细节。除了提供每个CUDA函数调用的时间分析外,它还能给出如何调用内核函数以及存储器的使用情况等。它有助于定位瓶颈可能出现的位置,并详细解释如何调用内核。

1.使用NVIDIA Visual Profiler进行CUDA分析

Visual Profiler是NVIDIA提供的图形化分析工具,其在成功安装CUDA toolkit后,就能够使用。通过Profiler能够对CUDA应用的CPU和GPU的时间节点进行分析,并能够调优CUDA应用的性能。Visual Profiler的简单使用方法如下所示:

  1. 启动:在控制终端输入命令:nvvp;如图 5所示的启动后界面。

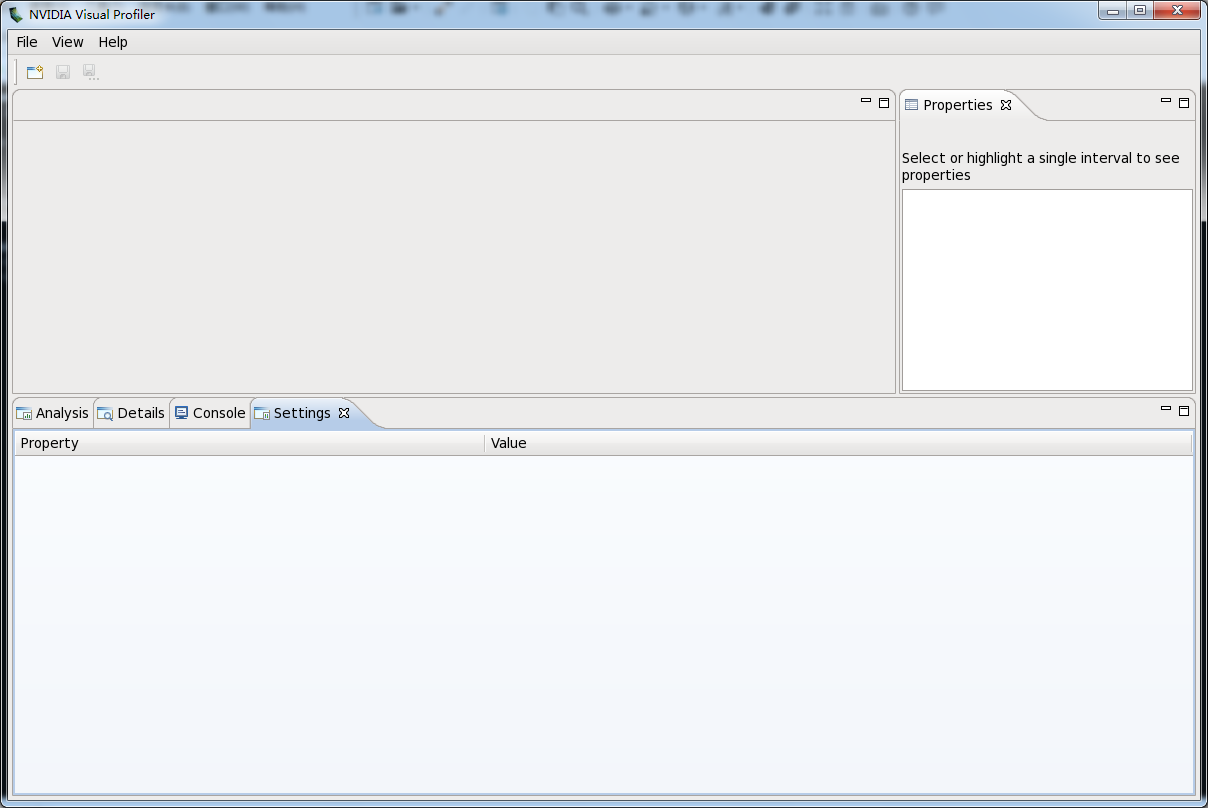
  1. 新建session:其创建入口为:FileNew Session,如图所示是新建Session对话框,在该对话框中的File输入框中输入需被分析的可执行文件。

  1. 分析结果:在新建Session对话框中输入相应的可执行文件后,就能产生分析结果,如图所示。

2.nvprof Profiler:命令行

通过nvprof可以以命令行的形式分析和调优CUDA应用程序。nvprof的使用形式是:

nvprof [options] [CUDA-application] [application-arguments]

  1. summary模型

这是nvprof的默认模型,在这个模型中只简单输出核函数和CUDA内存复制性能。如对于需要被测试的可执行文件boxFilterNPP,可直接执行命令:nvprof boxFilterNPP。如图所示的结果。

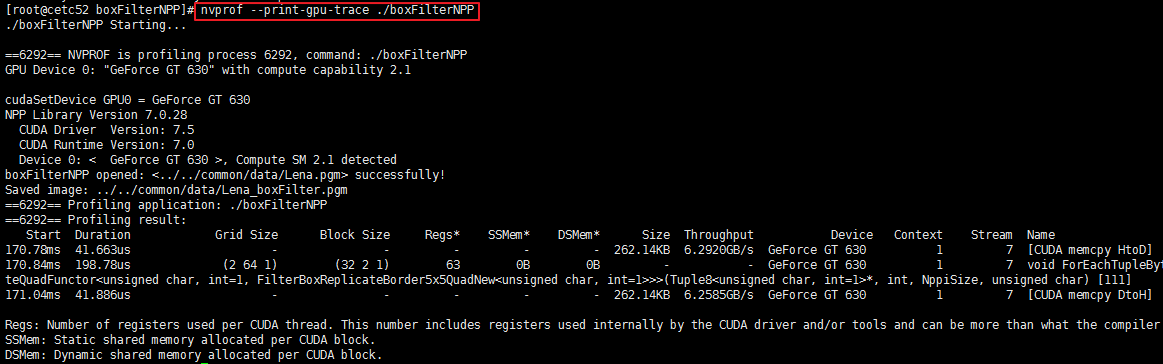
  1. GPU-Trace和API-Trace模型

这个模型能够以时间轴顺序提供所有在GPU发生的活动点,每个核函数的执行或是复制/赋值都能够详细的显示。如图所示。

  1. Event/metric Summary模型

通过这个模型能够在指定的NVIDIA GPU上显示所有可用的Event/metric,

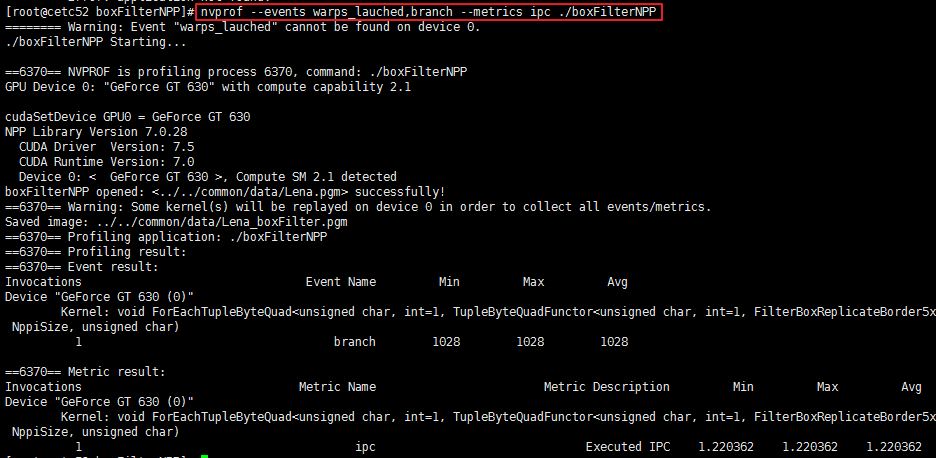
  1. Event/metric Trace Mode

通过这个模型能够显示每个核函数的event和metric值。如图所示。

使用Visual Profiler分析Python程序

  1. 命令行格式
1
$ nvprof python train_mnist.py

输出如下

1
2
3
4
5
6
7
8
9
10
11
12
13
14
15
16
17
18
19
20
21
22
23
24
25
26
27
28
29
30
31
32
33
34
35
36
37
38
39
40
41
42
43
44
45
46
$ nvprof python examples/stream/cusolver.py                                                                                                                                              [10/1910]
==27986== NVPROF is profiling process 27986, command: python examples/stream/cusolver.py
==27986== Profiling application: python examples/stream/cusolver.py
==27986== Profiling result:
Time(%) Time Calls Avg Min Max Name
41.70% 125.73us 4 31.431us 30.336us 33.312us void nrm2_kernel<double, double, double, int=0, int=0, int=128, int=0>(cublasNrm2Params<double, double>)
21.94% 66.144us 36 1.8370us 1.7600us 2.1760us [CUDA memcpy DtoH]
13.77% 41.536us 48 865ns 800ns 1.4400us [CUDA memcpy HtoD]
3.02% 9.1200us 2 4.5600us 3.8720us 5.2480us void syhemv_kernel<double, int=64, int=128, int=4, int=5, bool=1, bool=0>(cublasSyhemvParams<double>)
2.65% 8.0000us 2 4.0000us 3.8720us 4.1280us void gemv2T_kernel_val<double, double, double, int=128, int=16, int=2, int=2, bool=0>(int, int, double, double const *, int, double const *, i
nt, double, double*, int)
2.63% 7.9360us 2 3.9680us 3.8720us 4.0640us cupy_copy
2.44% 7.3600us 2 3.6800us 3.1680us 4.1920us void syr2_kernel<double, int=128, int=5, bool=1>(cublasSyher2Params<double>, int, double const *, double)
2.23% 6.7200us 2 3.3600us 3.2960us 3.4240us void dot_kernel<double, double, double, int=128, int=0, int=0>(cublasDotParams<double, double>)
1.88% 5.6640us 2 2.8320us 2.7840us 2.8800us void reduce_1Block_kernel<double, double, double, int=128, int=7>(double*, int, double*)
1.74% 5.2480us 2 2.6240us 2.5600us 2.6880us void ger_kernel<double, double, int=256, int=5, bool=0>(cublasGerParams<double, double>)
1.57% 4.7360us 2 2.3680us 2.1760us 2.5600us void axpy_kernel_val<double, double, int=0>(cublasAxpyParamsVal<double, double, double>)
1.28% 3.8720us 2 1.9360us 1.7920us 2.0800us void lacpy_kernel<double, int=5, int=3>(int, int, double const *, int, double*, int, int, int)
1.19% 3.5840us 2 1.7920us 1.6960us 1.8880us void scal_kernel_val<double, double, int=0>(cublasScalParamsVal<double, double>)
0.98% 2.9440us 2 1.4720us 1.2160us 1.7280us void reset_diagonal_real<double, int=8>(int, double*, int)
0.98% 2.9440us 4 736ns 736ns 736ns [CUDA memset]

==27986== API calls:
Time(%) Time Calls Avg Min Max Name
60.34% 408.55ms 9 45.395ms 4.8480us 407.94ms cudaMalloc
37.60% 254.60ms 2 127.30ms 556ns 254.60ms cudaFree
0.94% 6.3542ms 712 8.9240us 119ns 428.32us cuDeviceGetAttribute
0.72% 4.8747ms 8 609.33us 320.37us 885.26us cuDeviceTotalMem
0.10% 693.60us 82 8.4580us 2.8370us 72.004us cudaMemcpyAsync
0.08% 511.79us 1 511.79us 511.79us 511.79us cudaHostAlloc
0.08% 511.75us 8 63.969us 41.317us 99.232us cuDeviceGetName
0.05% 310.04us 1 310.04us 310.04us 310.04us cuModuleLoadData
0.03% 234.87us 24 9.7860us 5.7190us 50.465us cudaLaunch
0.01% 50.874us 2 25.437us 16.898us 33.976us cuLaunchKernel
0.01% 49.923us 2 24.961us 15.602us 34.321us cudaMemcpy
0.01% 47.622us 4 11.905us 8.6190us 19.889us cudaMemsetAsync
0.01% 44.811us 2 22.405us 9.5590us 35.252us cudaStreamDestroy
0.01% 35.136us 27 1.3010us 289ns 5.8480us cudaGetDevice
0.00% 31.113us 24 1.2960us 972ns 3.2380us cudaStreamSynchronize
0.00% 30.736us 2 15.368us 4.4580us 26.278us cudaStreamCreate
0.00% 13.932us 17 819ns 414ns 3.7090us cudaEventCreateWithFlags
0.00% 13.678us 70 195ns 130ns 801ns cudaSetupArgument
0.00% 12.050us 4 3.0120us 2.1290us 4.5130us cudaFuncGetAttributes
0.00% 10.407us 22 473ns 268ns 1.9540us cudaDeviceGetAttribute
0.00% 10.370us 40 259ns 126ns 1.4100us cudaGetLastError
0.00% 9.9680us 16 623ns 185ns 2.9600us cuDeviceGet

可以增加额外参数,指定模式。

1
$ nvprof --print-gpu-trace python train_mnist.py

输出如下

1
2
3
4
5
6
7
8
9
10
11
12
13
14
15
16
17
18
19
20
21
22
23
24
25
26
27
28
29
30
31
32
33
34
35
36
$ nvprof --print-gpu-trace python examples/stream/cusolver.py
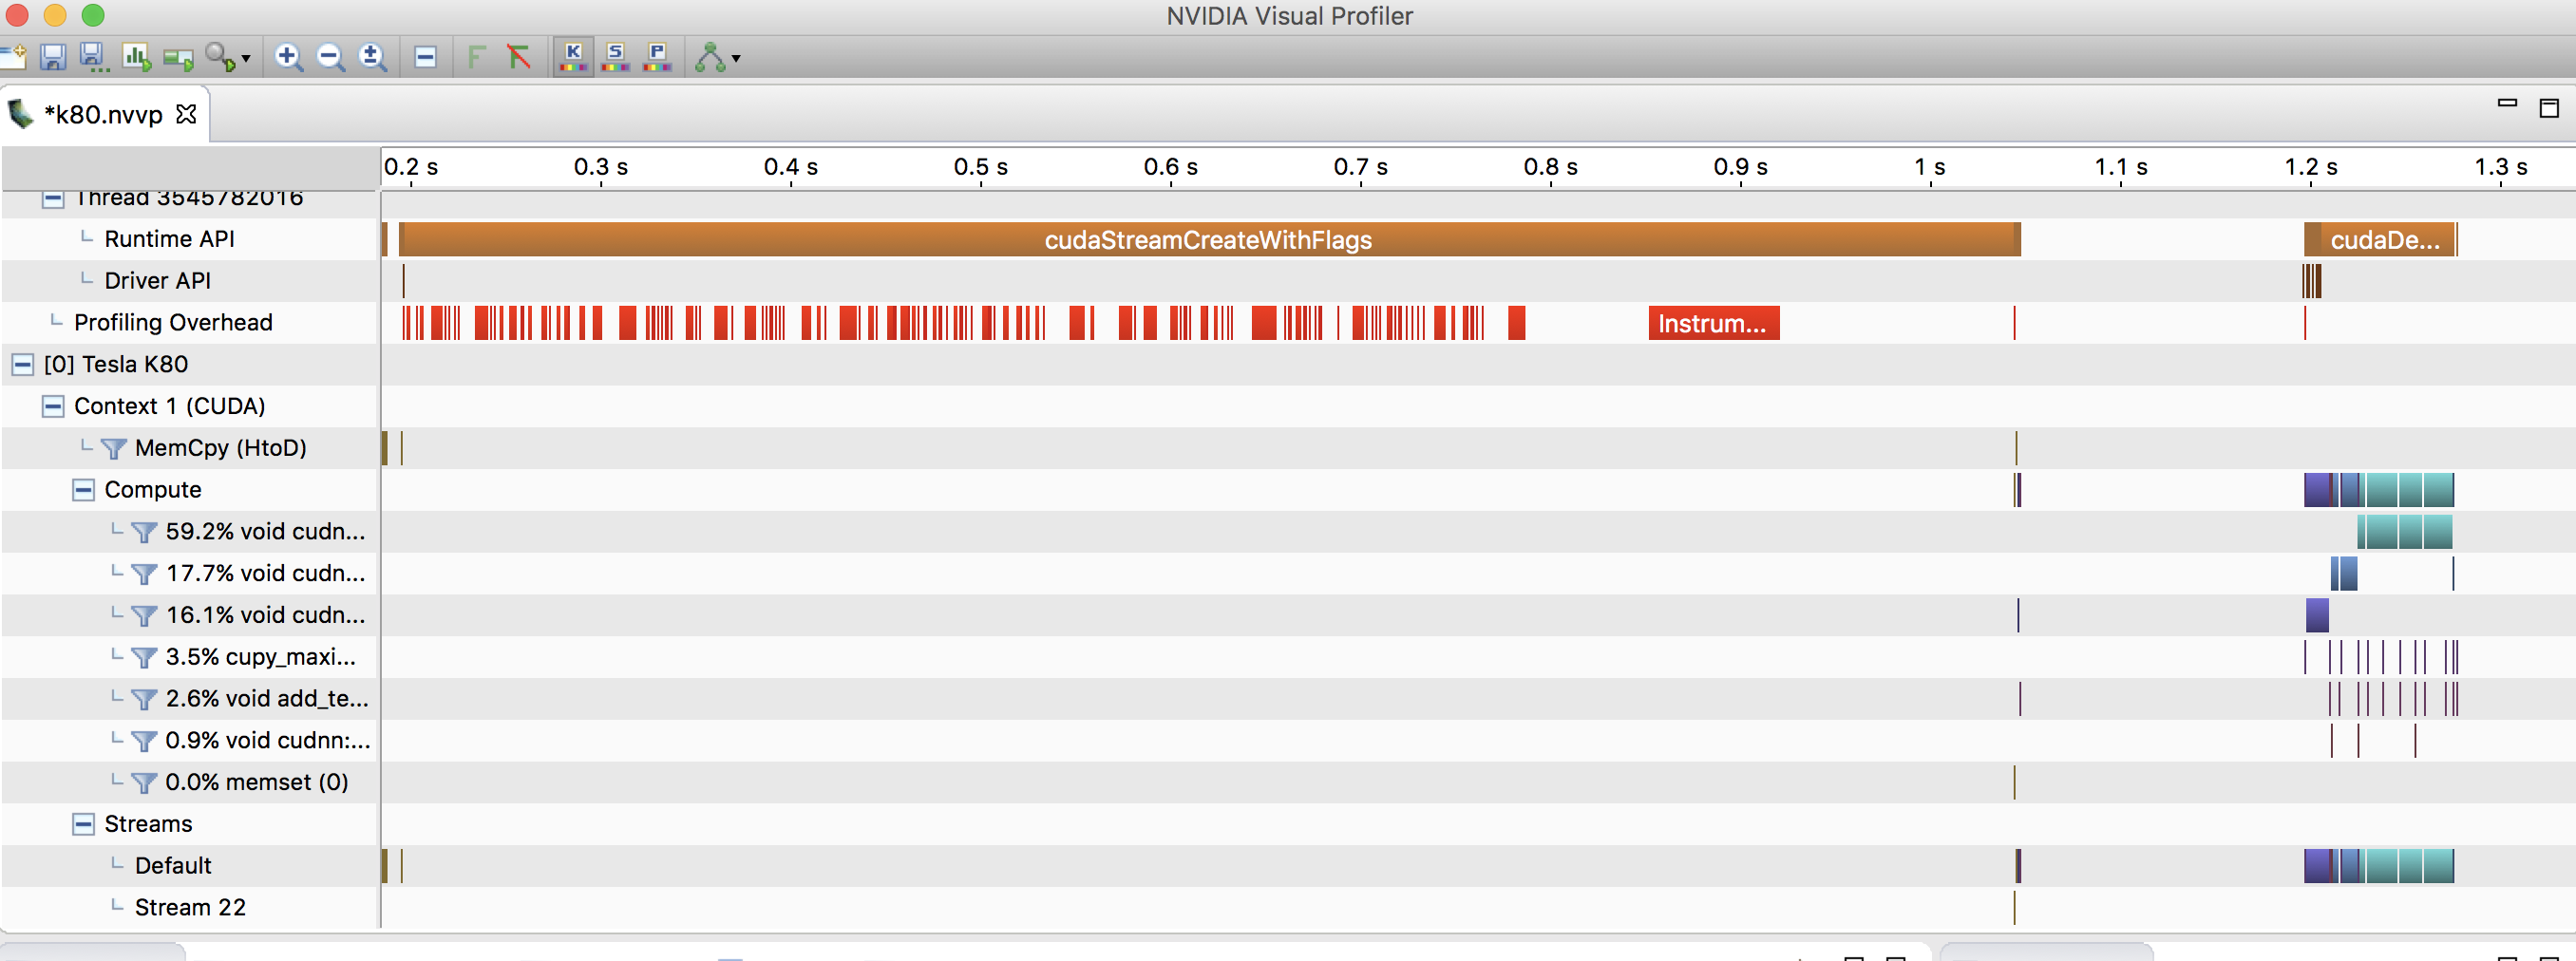
==28079== NVPROF is profiling process 28079, command: python examples/stream/cusolver.py
==28079== Profiling application: python examples/stream/cusolver.py
==28079== Profiling result:
Start Duration Grid Size Block Size Regs* SSMem* DSMem* Size Throughput Device Context Stream Name
652.12ms 1.5360us - - - - - 72B 44.703MB/s GeForce GTX TIT 1 7 [CUDA memcpy HtoD]
885.35ms 3.5520us (1 1 1) (9 1 1) 35 0B 0B - - GeForce GTX TIT 1 13 cupy_copy [412]
1.17031s 1.2160us - - - - - 112B 87.838MB/s GeForce GTX TIT 1 7 [CUDA memcpy HtoD]
1.17104s 1.2800us - - - - - 4B 2.9802MB/s GeForce GTX TIT 1 13 [CUDA memcpy HtoD]
1.17117s 2.2400us - - - - - 72B 30.654MB/s GeForce GTX TIT 1 13 [CUDA memcpy DtoH]
1.17119s 864ns - - - - - 4B 4.4152MB/s GeForce GTX TIT 1 13 [CUDA memcpy HtoD]
1.17123s 1.3760us (1 1 1) (256 1 1) 8 0B 0B - - GeForce GTX TIT 1 13 void reset_diagonal_real<double, int=8>(int, double*, i
nt) [840]
1.17125s 768ns - - - - - 16B 19.868MB/s GeForce GTX TIT 1 13 [CUDA memset]
1.17127s 32.928us (1 1 1) (128 1 1) 30 1.0000KB 0B - - GeForce GTX TIT 1 13 void nrm2_kernel<double, double, double, int=0, int=0,
int=128, int=0>(cublasNrm2Params<double, double>) [848]
1.17130s 30.016us (1 1 1) (128 1 1) 30 1.0000KB 0B - - GeForce GTX TIT 1 13 void nrm2_kernel<double, double, double, int=0, int=0,
int=128, int=0>(cublasNrm2Params<double, double>) [853]
1.17134s 2.0160us - - - - - 8B 3.7844MB/s GeForce GTX TIT 1 13 [CUDA memcpy DtoH]
1.17135s 1.7920us - - - - - 8B 4.2575MB/s GeForce GTX TIT 1 13 [CUDA memcpy DtoH]
1.17137s 1.8560us (1 1 1) (384 1 1) 10 0B 0B - - GeForce GTX TIT 1 13 void scal_kernel_val<double, double, int=0>(cublasScalP
aramsVal<double, double>) [863]
1.17138s 832ns - - - - - 8B 9.1699MB/s GeForce GTX TIT 1 13 [CUDA memcpy HtoD]
1.17138s 864ns - - - - - 8B 8.8303MB/s GeForce GTX TIT 1 13 [CUDA memcpy HtoD]
1.17139s 1.8240us - - - - - 8B 4.1828MB/s GeForce GTX TIT 1 13 [CUDA memcpy DtoH]
1.17140s 1.8880us - - - - - 8B 4.0410MB/s GeForce GTX TIT 1 13 [CUDA memcpy DtoH]
1.17141s 864ns - - - - - 8B 8.8303MB/s GeForce GTX TIT 1 13 [CUDA memcpy HtoD]
1.17142s 832ns - - - - - 8B 9.1699MB/s GeForce GTX TIT 1 13 [CUDA memcpy HtoD]
1.17143s 5.6320us (64 1 1) (128 1 1) 48 5.5000KB 0B - - GeForce GTX TIT 1 13 void syhemv_kernel<double, int=64, int=128, int=4, int=
5, bool=1, bool=0>(cublasSyhemvParams<double>) [875]
1.17145s 3.9360us (1 1 1) (128 1 1) 14 1.0000KB 0B - - GeForce GTX TIT 1 13 void dot_kernel<double, double, double, int=128, int=0,
int=0>(cublasDotParams<double, double>) [882]
1.17146s 3.0400us (1 1 1) (128 1 1) 16 1.5000KB 0B - - GeForce GTX TIT 1 13 void reduce_1Block_kernel<double, double, double, int=1
28, int=7>(double*, int, double*) [888]

[omitted]
  1. 图形化界面

首先使用nvvp将记录文件输出

1
$ nvprof -o prof.nvvp python train_mnist.py

然后把.nvvp文件拷贝到要分析的文件夹下,启动nvidia visual profiler

1
$ nvvp prof.nvvp

输出如下

参考文献

  1. CUDA_Profiler_Users_Guide.pdf
0%